Tuesday, 18 September 2012

TASI Trend Score

Technical Status of TASI

Trend Score: +17 (Strong Uptrend)
Long Term Trend: UP
Medium Term Trend: UP
Short Term Trend: UP
Ultra Short Term or Swing Trend: UP
14 Day RSI: Slightly Overbought
Support: 7000
Resistance: 7200


KSE-100 Index Trend Score

Technical Status of KSE-100 Index

Trend Score: +17 (Strong Uptrend)
Long Term Trend: UP
Medium Term Trend: UP
Short Term Trend: UP
Ultra Short Term or Swing Trend: UP
14 Day RSI: Overbought
Support: 15000
Resistance: 15500


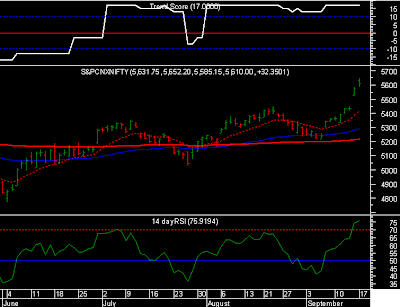
NIFTY Trend Score

Technical Status of NIFTY Index

Trend Score: +17 (Strong uptrend)
Long Term Trend: UP
Medium Term Trend: UP
Short Term Trend: UP
Ultra Short Term or Swing Trend: UP
14 Day RSI: Overbought
Support: 5500
Resistance: 5650


Monday, 17 September 2012

TASI Trend Score

Technical Status of TASI 

Trend Score: +17 (Strong Uptrend)
Long Term Trend: UP
Medium Term Trend: UP
Short Term Trend: UP
Ultra Short Term Trend or Swing Trend: UP
14 Day RSI: Slightly Overbought
Support: 7000
Resistance: 7200, 7500


Swing trades and Intraday ranges


KSE-100 Index Trend Score

Technical Status of KSE-100 Index

Trend Score: +17 (Strong Uptrend)
Long Term Trend: UP
Medium Term Trend: UP
Short Term Trend: UP
Ultra Short Term Trend or Swing Trend: UP
14 Day RSI: Overbought
Support: 15100, 15000
Resistance: 15500


NIFTY Trend Score

Technical status of NIFTY Index
 
Trend Score: +17 (Strong Uptrend)
Long Term Trend: UP
Medium Term Trend: UP
Short Term Trend: UP
 Ultra Short Term Trend or Swing Trend: UP 
14 Day RSI: Overbought
Support: 5500, 5450
Resistance: 5650


NIFTY Intraday Chart


Swing Trend and Intraday Ranges


Saturday, 15 September 2012

How to interpret the Trend Score Table


The Trend Score table has six sections. The sections are:


Symbol: The ticker symbol of the stock or the Index

Closing Price: The last closing price of the stock or the Index

Swing Trade: The formula of swing trade is based on the performance of stock on last three trading days. The system tries to capture the very short term price swings which may last 2 to 5 days and generate returns in the range of 5% to 10%. Please remember, this is a high risk high return strategy and only professional traders should follow this. The system is totally mechanical in nature.

Buying Range Today: Since Swing Trade is a high risk trading strategy, it is far better idea to execute it on a day to day basis using the trend of Swing. For example, if the stock is showing “Buy” in the Swing Trade column, it is better to accumulate the stock using the Buying Range Today prices and book profits either on higher levels or use the Selling Range Today prices. Carry forward the trade, if possible; otherwise square it before the close. Please use stoploss based on your risk tolerance.

Selling Range Today: Vice versa of Buying Range Today column.

Trend Score Today:  Trend Score identifies the long term trend of the stock. It hovers in the range of +17 (Strong uptrend) and -17 (Strong downtrend). The detailed explanation is can be accessed here.

Use of Trend Score table is not limited to trading the intraday ranges. Passive investors with a horizon greater than six months can use the Trend Score column to buy and stocks based on Trend Score method. Investors can increase/decrease the portfolio holding based on the movement in Trend Score. The intraday ranges can be used for timing the accumulation and distribution of portfolio holdings.